
Expense Management Software for Real Estate Team Leads
Every team lead coaches on activity: calls made, showings booked, offers written. Almost none coach on spend. That is the gap. An agent who spends $1,800 to close a deal and an agent who spends $400 to close the same size deal are not performing the same, even if their production numbers look identical on a leaderboard. Expense visibility per closing is the coaching surface most teams never open, because the data lives in twelve different places: a credit card statement, a Zillow invoice, a stack of receipts, an agent's memory.
Coach to the numbers, not the vibe
When a team lead can see each agent's spend per closing, side by side, the conversation changes. It stops being "spend less" and starts being specific: this agent's cost per lead from one portal is three times another agent's, this agent is still paying for a lead source that has not produced a closing in four months, this agent's marketing spend is healthy but their transaction fees are eating the difference. That is a coaching conversation a spreadsheet built once a quarter cannot support, because by the time the numbers are compiled the deal, and the lesson, is old news.
RealtyProfit gives team leads a live team P&L dashboard with per-agent profitability, broken down by deal. AI extraction pulls the numbers off closing documents and receipts as they come in, so nobody is manually keying expenses or waiting on an agent to submit anything. Expenses get categorized automatically, marketing ROI is tracked by channel so a lead can see which portals and vendors are actually producing, and commission waterfalls show exactly what each agent netted after splits, caps, and fees. CSV import brings in a year of history in one pass instead of rebuilding it by hand.
Spend per closing, visible
See what each deal actually cost an agent to close, not just what they earned.
Automatic categorization
AI reads closing documents and receipts, sorts spend by category, no manual entry.
Marketing ROI by channel
Know which lead sources are actually converting to closings, agent by agent.
DisclosureGuard scanning
Closing documents get scanned for disclosure issues as they come in, not after.
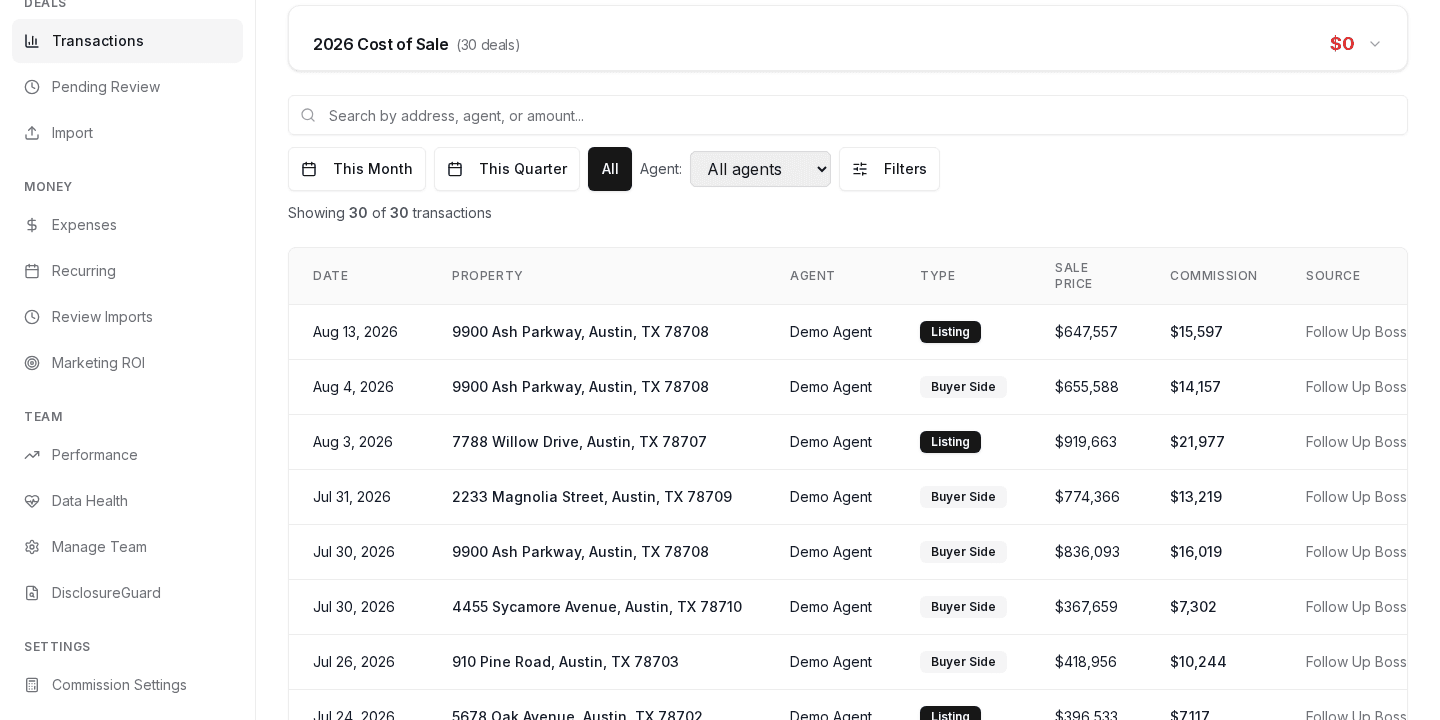
What a ceiling actually looks like
Coaching an agent to their ceiling means knowing what their ceiling costs. An agent who is spending efficiently has room to reinvest in more lead generation and grow. An agent who is bleeding money on marketing that is not converting has a ceiling that is lower than their production number suggests, and no amount of activity coaching fixes that. Cap tracking shows a team lead exactly where each agent sits against their annual cap in real time, so cap conversations happen with the actual number in front of both people instead of an estimate.
This pairs directly with team profit tracking, which rolls per-agent numbers up into a full team view. If you want to see what a single deal's split and fees actually net an agent, the commission split calculator runs that math in seconds.
The Agent plan is $79/month, the Team plan is $399/month for 5 to 30 agents, and the Brokerage plan is $1,499/month for unlimited agents and teams. Sign up on the free profit call and your first 30 days are free.
The demo runs on sample data. No signup, about 60 seconds.