
The real estate profit and loss template every team lead should be using
Most team leads track revenue closely and expenses loosely. They know GCI to the dollar and have a vague sense of "marketing costs a lot" without knowing which channel is actually working. A real P&L fixes that by forcing every dollar into a category, so you can see not just whether you're profitable, but why.
What belongs on a real estate team P&L
Start with income: gross commission income and any splits coming in from agent transactions. Then expenses, broken into three groups that map to how the money actually gets spent -- lead generation by channel (so you know your cost per lead and cost per closing, not just a total marketing line), cost of sale (agent splits, TC fees, royalty and franchise fees if you're flagged), and operating expenses (staff, occupancy, tech). Below all of that sits net profit, and the one number most spreadsheets skip entirely: profit per agent. That single figure tells you more about team health than GCI ever will, because it separates "we closed a lot of deals" from "we actually kept money after paying for them."
Line items, broken down
Income
- Gross Commission Income (GCI)
- Total commission earned across all closed transactions, before splits.
- Splits In
- Commission owed to the brokerage or team lead from agent transactions.
Expenses -- Lead Generation
- Paid leads by channel
- Zillow, Realtor.com, PPC, social -- tracked separately, not lumped together.
- Referral fees
- Paid out to referral sources on closed deals.
- Marketing and advertising
- Print, signage, listing promotion, direct mail.
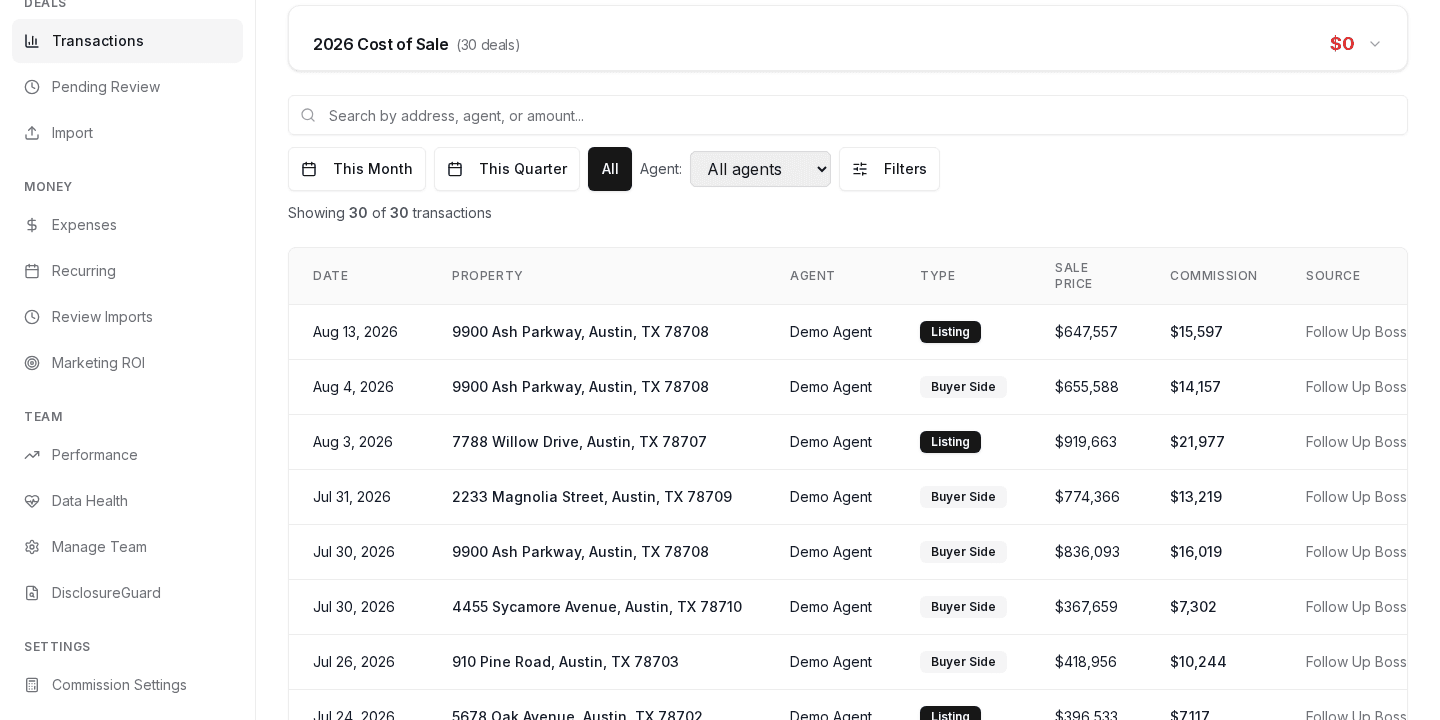
Expenses -- Cost of Sale
- Agent commission splits
- What agents keep after the team or brokerage split.
- Transaction coordination fees
- Per-file TC costs, in-house or contracted.
- Royalty and franchise fees
- Off the top, if applicable to your brand.
Expenses -- Operating
- Staff and payroll
- Admin, ISA, marketing coordinator, ops manager salaries.
- Occupancy
- Office lease, utilities, shared workspace fees.
- Technology
- CRM, transaction management, phone systems, software stack.
Below the Line
- Net Profit
- Income minus all expenses. The number that actually matters.
- Profit Per Agent
- Net profit divided across producing agents, the clearest health check you have.
Build this in a spreadsheet and it works fine for a solo agent or a two-person team. The problem shows up once you're pulling numbers from a dozen closing statements a month, splitting them across agents with different cap structures, and trying to keep lead source data current. At that point the template stops being the bottleneck and manual entry becomes the bottleneck.
When a template stops being enough
Once a team hits five or more agents, the spreadsheet version of this template gets hard to maintain honestly. RealtyProfit replaces it with a live team P&L dashboard built on the same line items above, but populated automatically. AI extraction pulls the numbers off closing documents, expenses get categorized into the same MREA-style buckets you'd use in a spreadsheet, and commission waterfalls and cap tracking run per agent without a manual lookup. You still get marketing ROI by channel and profit per agent, just without re-typing them every month. If you already have months of spreadsheet history, CSV import brings it in rather than starting your trend lines over.
The Agent plan is $79/month, the Team plan is $399/month for 5 to 30 agents, and the Brokerage plan is $1,499/month for unlimited agents and teams. Sign up on the free profit call and your first 30 days are free.The demo at /demo uses sample data, no signup required, and takes about 60 seconds to look through.
If your team already runs on the Millionaire Real Estate Agent model, see how the same economics work without manual entry in our MREA spreadsheet alternative breakdown. Or run a quick gut check on your current numbers with the profit calculator.